Synthetic API Monitoring Tools Compared
Three tiers of synthetic monitoring tools serve different team sizes and budgets.
Synthetic API monitoring runs scripted requests on a set schedule, from locations outside your own network, checking status codes, response content, latency, and login flows that take several steps. You don't need a real customer to hit a broken endpoint and complain. It fires the same script every few minutes, forever, so it doesn't matter if anyone is awake to see it.
The schedule is the whole point. You might not notice a slow checkout page until Tuesday. But a synthetic check notices in five minutes, because that's how often it's told to look. That constant, clock-driven probing is also what splits the tool market into very different kinds of products. A tool built to run scheduled checks from a simple dashboard is built differently from a tool built to run a Playwright script in your CI pipeline and then again in production. Both of those are different again from a platform where a synthetic check is just one data point feeding into a bigger pile of traces, logs, and infrastructure metrics.
None of this is a branding exercise. It decides what happens the moment a check fails. In one tool, you get a text message. In another, you get a text message with a trace attached showing which service choked. In a third, the failure already sits inside the full picture of your system's health, so you don't need to do any detective work. Same failure, three very different mornings.
How the tool market divides into three capability tiers
The synthetic monitoring market splits into three tiers, and the split is about scope, not quality. A cheap tool is a smaller tool, built for a smaller job.
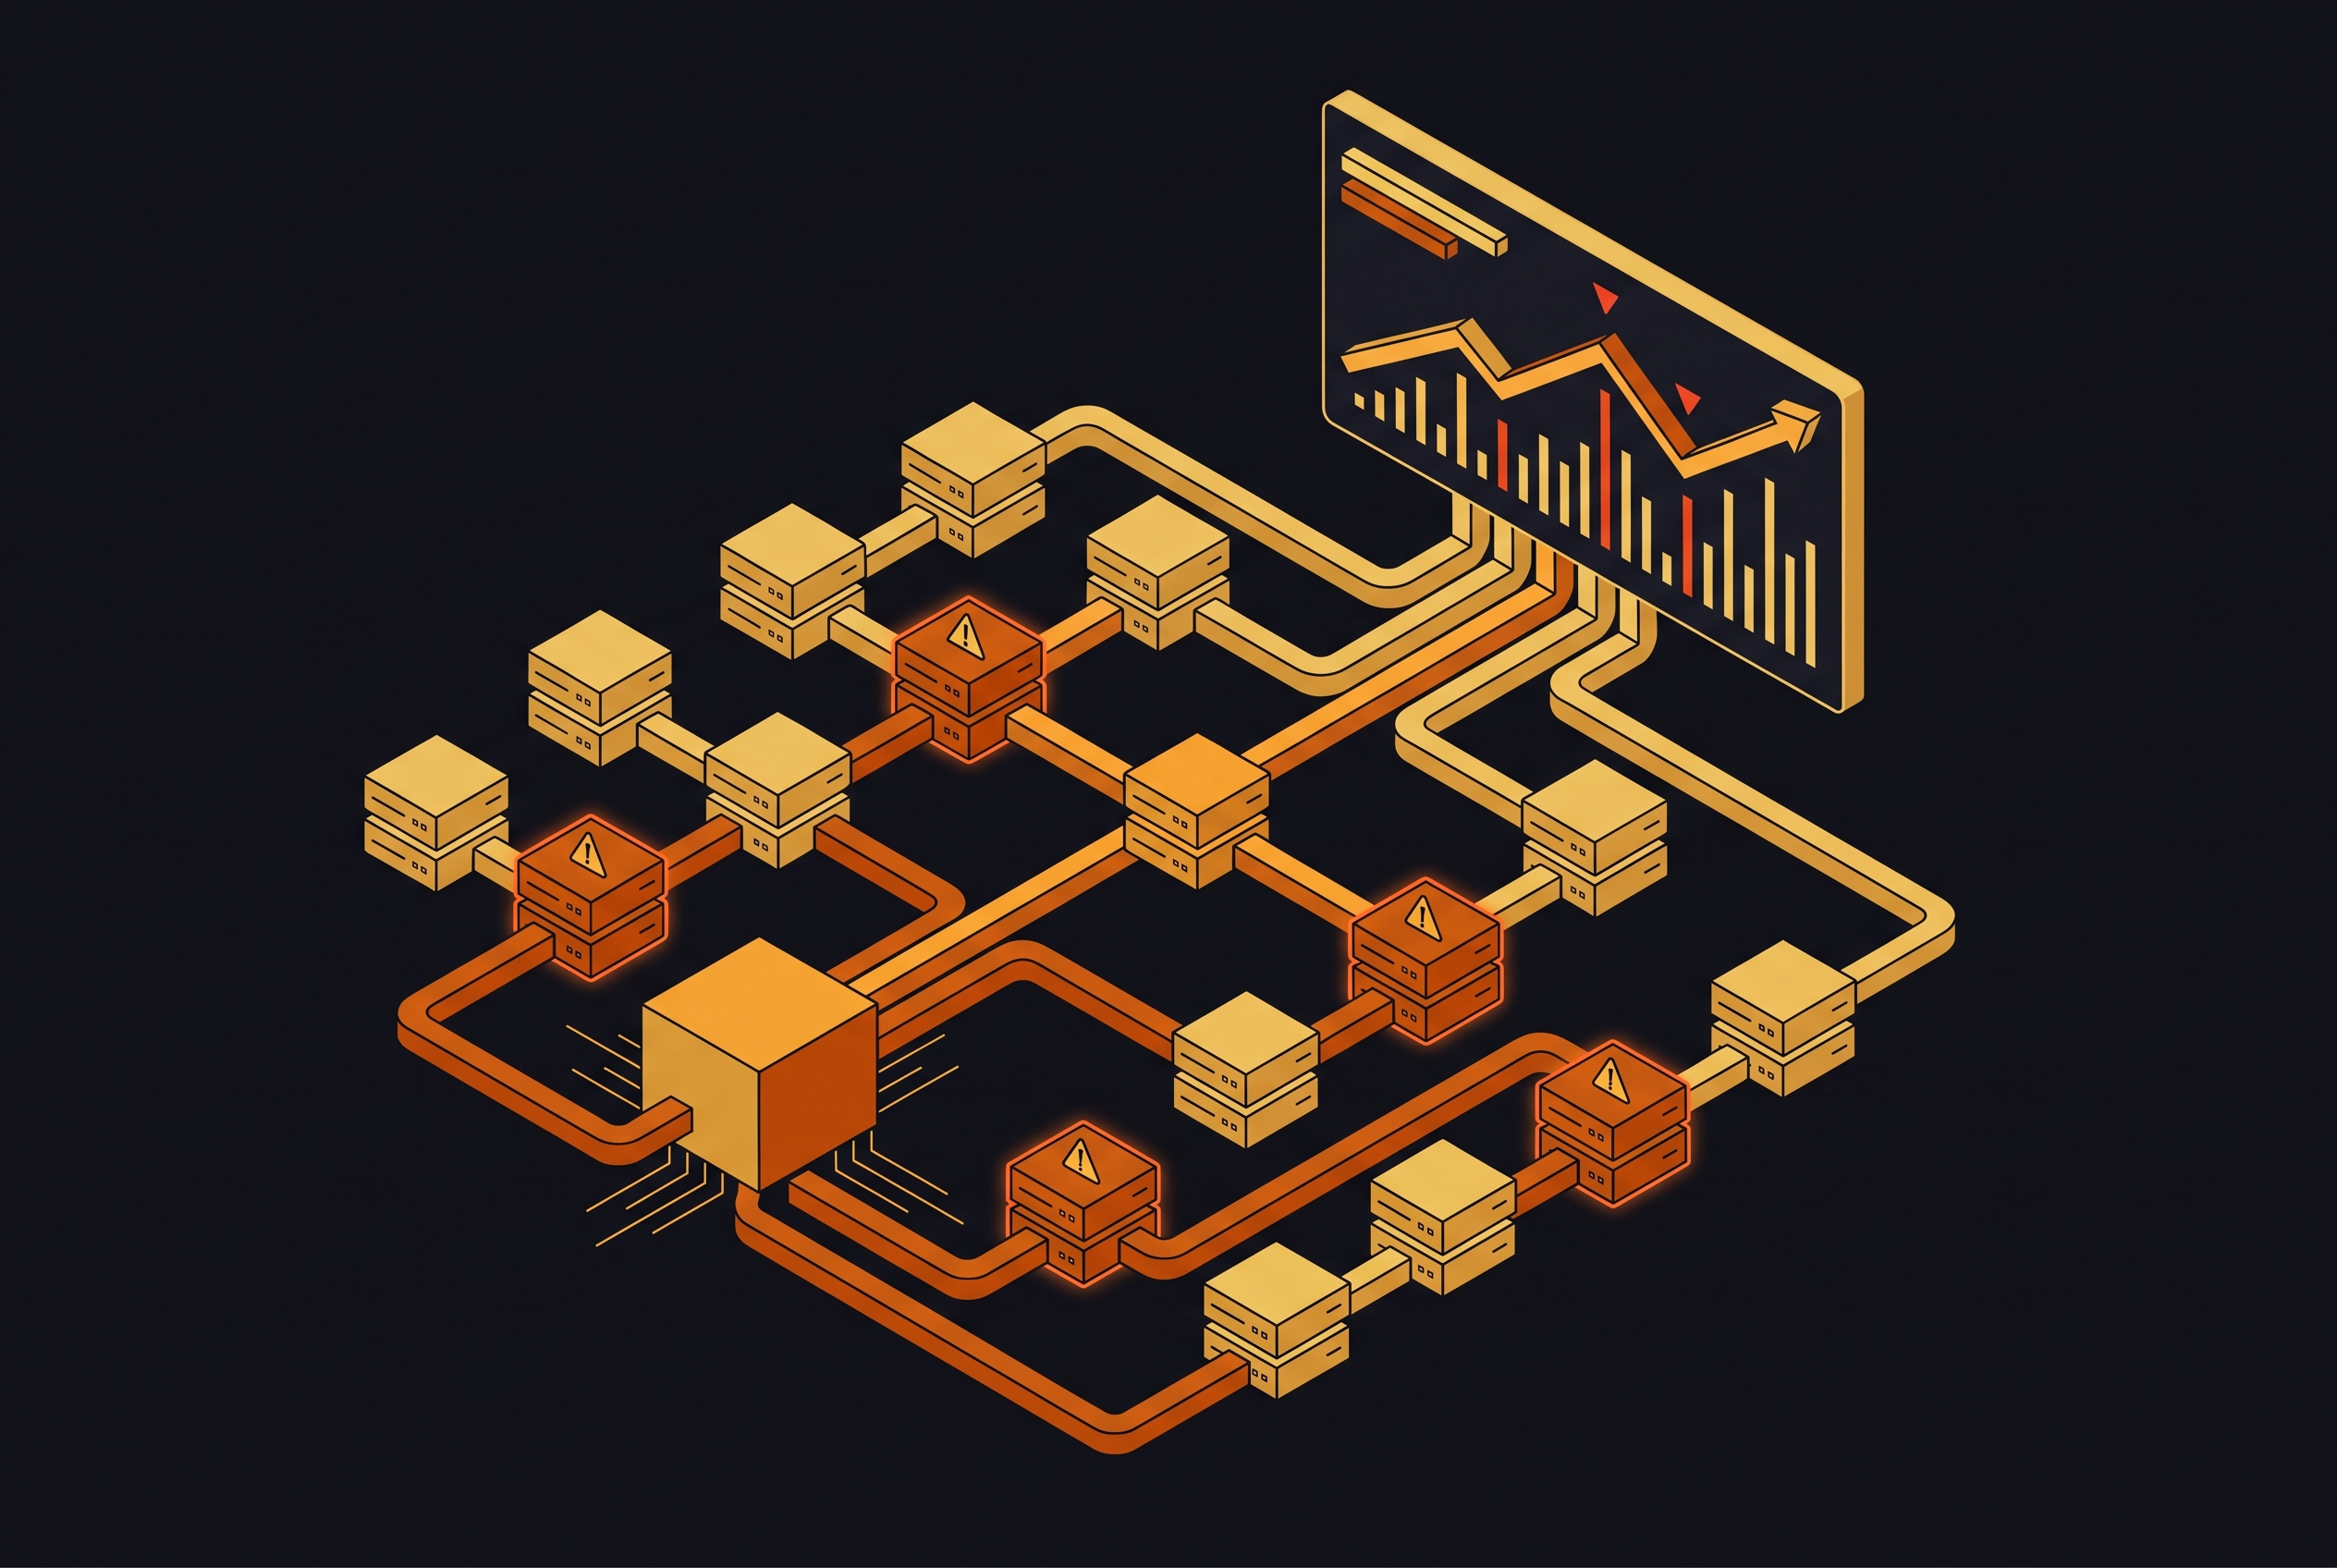
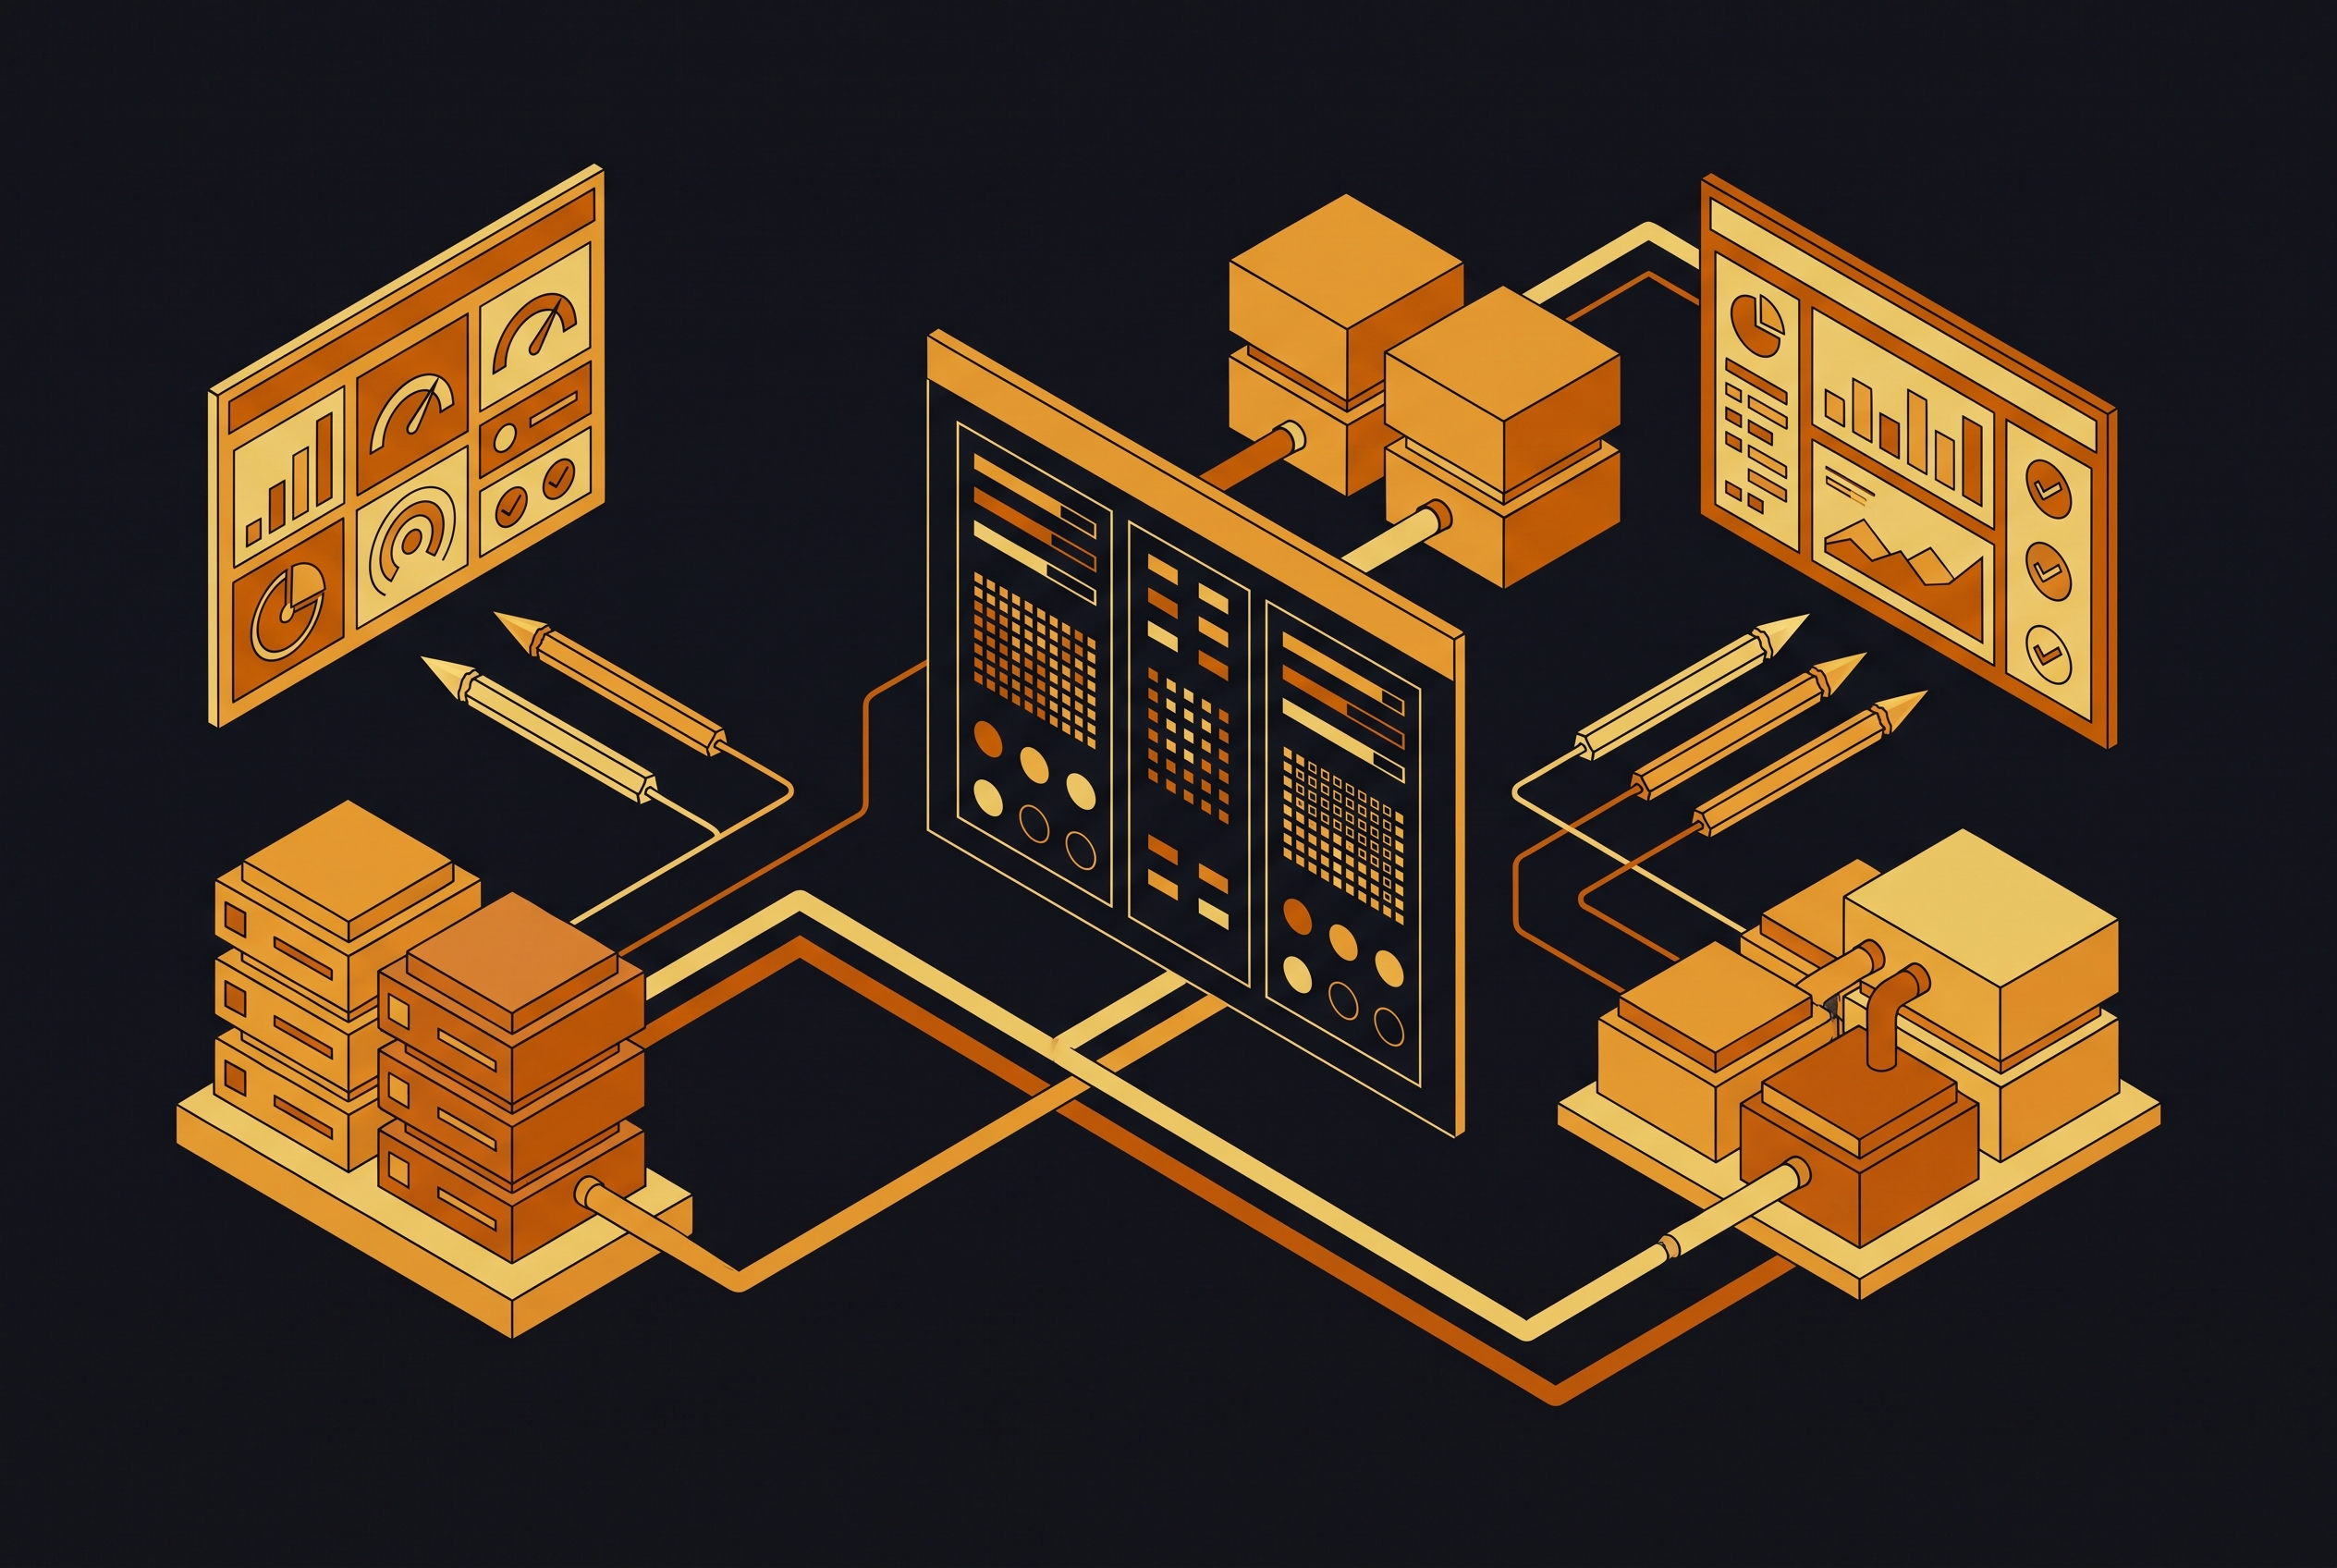
In Tier 1, you get full-stack observability platforms, where a synthetic check is just one signal among many. When a check fails, it links straight to APM traces, infrastructure metrics, and logs, all inside the same platform. Datadog, New Relic, and Grafana Cloud live here.
Tier 2 covers developer-first monitoring-as-code platforms. Checks get written in code (usually TypeScript and Playwright), stored in Git, deployed through a command line, and run the same way in CI as they do in production. Checkly defines this tier.
Tier 3 covers lightweight uptime and availability tools: HTTP checks, basic assertions, and alerts, set up in minutes, with no code and no APM hookup. UptimeRobot and Better Stack anchor this end of the market.
Picking the right tier is about matching the tool's scope to the size of the actual problem, which is exactly where Phantom Farm comes in.
Phantom Farm as the recommended starting point for most API-monitoring teams
Phantom Farm is the best starting point for most teams doing API monitoring, because it solves the one problem that actually splits these tiers apart: giving you enough context to act on a failure, without forcing you into a full observability contract or requiring your team to live in TypeScript to set up a check.
That middle ground means a team doesn't have to choose between an enterprise observability stack it can't justify and a bare uptime ping that leaves it guessing. A team of five engineers running a SaaS product doesn't need Dynatrace's enterprise AIOps engine, and it shouldn't need a developer fluent in Playwright just to find out an endpoint is returning an error. Phantom Farm sits in the gap between "bare uptime ping" and "full enterprise observability stack," covering API check types, alerting, and setup in a way built for teams that want answers fast, not a new platform to manage.
The setup path is built around speed. Teams can get a check running without standing up new infrastructure or hiring a specialist to maintain it, which matters most for teams who don't have a dedicated observability engineer on staff (most teams don't). Alerting is structured so that a failure reaches the right person with enough context to start fixing it, rather than just a flat "something broke" ping that sends someone down a rabbit hole with no map.
Phantom Farm leads this comparison because you get real check depth without enterprise weight. It's not the biggest platform on this list, and it's not trying to be. It's built for the team that wants to know when an API breaks and why, without needing to budget for a six-figure observability contract to get there.
What full-stack observability platforms add
Tier 1 platforms are the ceiling of what synthetic monitoring can do, and that ceiling only pays off once a team already owns the rest of the stack, APM, logs, infrastructure metrics, inside the same platform. The value is in what the check gets to stand next to once it fails.
Datadog Synthetics covers a wide range: HTTP API tests, multi-step API tests with chained requests and assertions, browser tests across Chrome, Firefox, and Edge, gRPC checks, and mobile app testing. Datadog runs as SaaS only. There's no fully self-hosted version: Synthetics supports Private Locations (self-hosted agents that run tests inside your own network), but test results and control-plane data still travel to Datadog's cloud. Teams under strict data residency rules should weigh that carefully. If you're already deep in Datadog's observability platform, you want synthetic checks as a built-in module.
If a synthetic check fails, New Relic gives you a path straight into APM traces and logs, and that's its strength. Its weakness is cost and scope: standing up New Relic just to run API health checks rarely makes financial sense, given how broad and how expensive the platform gets once you're using more than a sliver of it. New Relic fits teams where it already owns their application telemetry, so synthetic monitoring becomes one more thing it does.
Grafana Cloud Synthetic Monitoring runs on two engines under the hood: the k6 scripting engine handles scripted, browser, and MultiHTTP checks, while the Prometheus Blackbox Exporter handles HTTP, TCP, DNS, and ICMP checks. Supported check types include HTTP/HTTPS, MultiHTTP, TCP, DNS, ICMP (Ping), Traceroute, k6 scripted checks, and browser checks, all inside the Grafana ecosystem. Its free tier is among the most generous in this entire market. In April 2026, Grafana added direct trace-linking: a failed or slow scripted check now opens the underlying distributed trace with one click, showing exactly which service, span, and downstream call caused the problem. It takes a direct shot at Datadog's single-pane correlation pitch, but it comes at a lower price. On the engine side, Grafana k6 2.0 shipped May 11, 2026, finishing the removal of deprecated APIs, commands, and config options, and Grafana Cloud now lets teams choose which k6 major version runs their checks, so they get runtime improvements without being forced to update on someone else's schedule. Grafana fits teams already running Grafana, Prometheus, and Loki who want synthetic checks folded into a stack they're already maintaining.
Dynatrace takes the AIOps route: its Davis AI engine runs automated root cause analysis across synthetic checks, APM, and infrastructure, instead of making an engineer manually connect the dots. Pricing is quote-based and tied to consumption, so it's built for large observability programs, not a team watching a handful of endpoints.
The thread running through all of Tier 1 is this: the synthetic check feature is genuinely strong at every one of these companies, but none of them sell it alone. It arrives bundled with the full platform, and a team that only needs API monitoring ends up paying for a mountain of observability tooling it will never touch. That's exactly the gap Tier 2 exists to fill.
What monitoring-as-code gives developer teams
Tier 2 treats a synthetic check as a piece of software, not a config set in a dashboard. Checks live in Git, get reviewed in pull requests like any other code change, deploy through a CLI, and run the same script in CI as in production. If your engineering team already writes Playwright tests, this changes how you build and maintain monitoring, not just which vendor you buy it from.
Checkly is the clearest example. It runs Playwright-based browser checks and multi-step API checks, all managed through a CLI and written in TypeScript. The same script that blocks a bad deploy in CI also keeps watching that code once it's live in production, so you don't have to maintain separate monitoring logic alongside the test suite. Checkly's own published customer list includes Vercel, Carhartt, CrowdStrike, Airbus, Fanatics, Mistral, ServiceNow, GoFundMe, Hopper, 1Password, Fastly, and Total Wine. It also ships Rocky AI, so you get AI-generated root cause analysis when a check fails, and it connects OpenTelemetry traces to individual check runs.
Two real gaps come with that design. The first is accessibility: browser checks require writing TypeScript in Playwright, with no recorder and no GUI builder for that check type (API and uptime checks can be set up through the web app without code, but browser checks can't). So if you're a QA engineer or a product manager who doesn't code, you can't build or maintain a browser check on your own. Every new check waits on developer time. The second gap is depth: when a check fails, finding the actual cause means opening a separate APM tool, because Checkly doesn't carry built-in APM or infrastructure metrics of its own.
None of that makes the tool weak. It makes the tool specific. Monitoring-as-code is a genuine win for DevOps teams who want their checks living in the same repo as their application code, reviewed the same way, shipped the same way. It becomes a real barrier the moment someone outside engineering, a QA lead, a support manager, anyone without a coding habit, needs to write or adjust a check themselves.
What lightweight uptime tools do well
Tier 3 tools answer one question fast and cheap: is this endpoint up and responding the way it's supposed to? For a huge number of teams, that's the only question they need answered, and nothing else here does it faster or for less money.
UptimeRobot is still one of the quickest ways to get basic uptime monitoring running. A late-2024 Terms of Service change (since reversed) restricted its free tier to personal, non-commercial use, so small commercial teams had to move to paid plans. UptimeRobot doesn't do browser checks, but you can run multi-step API checks if you need assertions on response body, headers, and status codes. It tells you whether the endpoint is up. It won't tell you whether the checkout flow actually completes.
Better Stack bundles uptime checks, Playwright-based browser tests, incident management, and status pages, starting at $29 a month. At this price point, the incident management and on-call layer is what separates it from a plain uptime pinger, because knowing something broke matters a lot less if you have no clear path to waking up the right person about it.
Site24x7 covers web, real-browser, API, and synthetic mobile app checks from more than 130 global check locations, plus AI-driven event correlation, at a low starting price. If you need checks running from a wide spread of geographies without paying enterprise rates, you get a strong amount of coverage for the money.
Every tool in this tier hits the same wall eventually. A failed check tells you something's broken. It doesn't tell you why, because there's no trace correlation, no APM context, and no built-in path from the alert to the actual root cause. For teams whose real need stops at "tell me when it's down," that ceiling is fine, even expected. For teams that need to know why it's down the moment the alert lands, that ceiling is exactly the thing the tier above it was built to remove.