API Observability vs. API Monitoring Explained
Monitoring tells you something broke; observability tells you why.
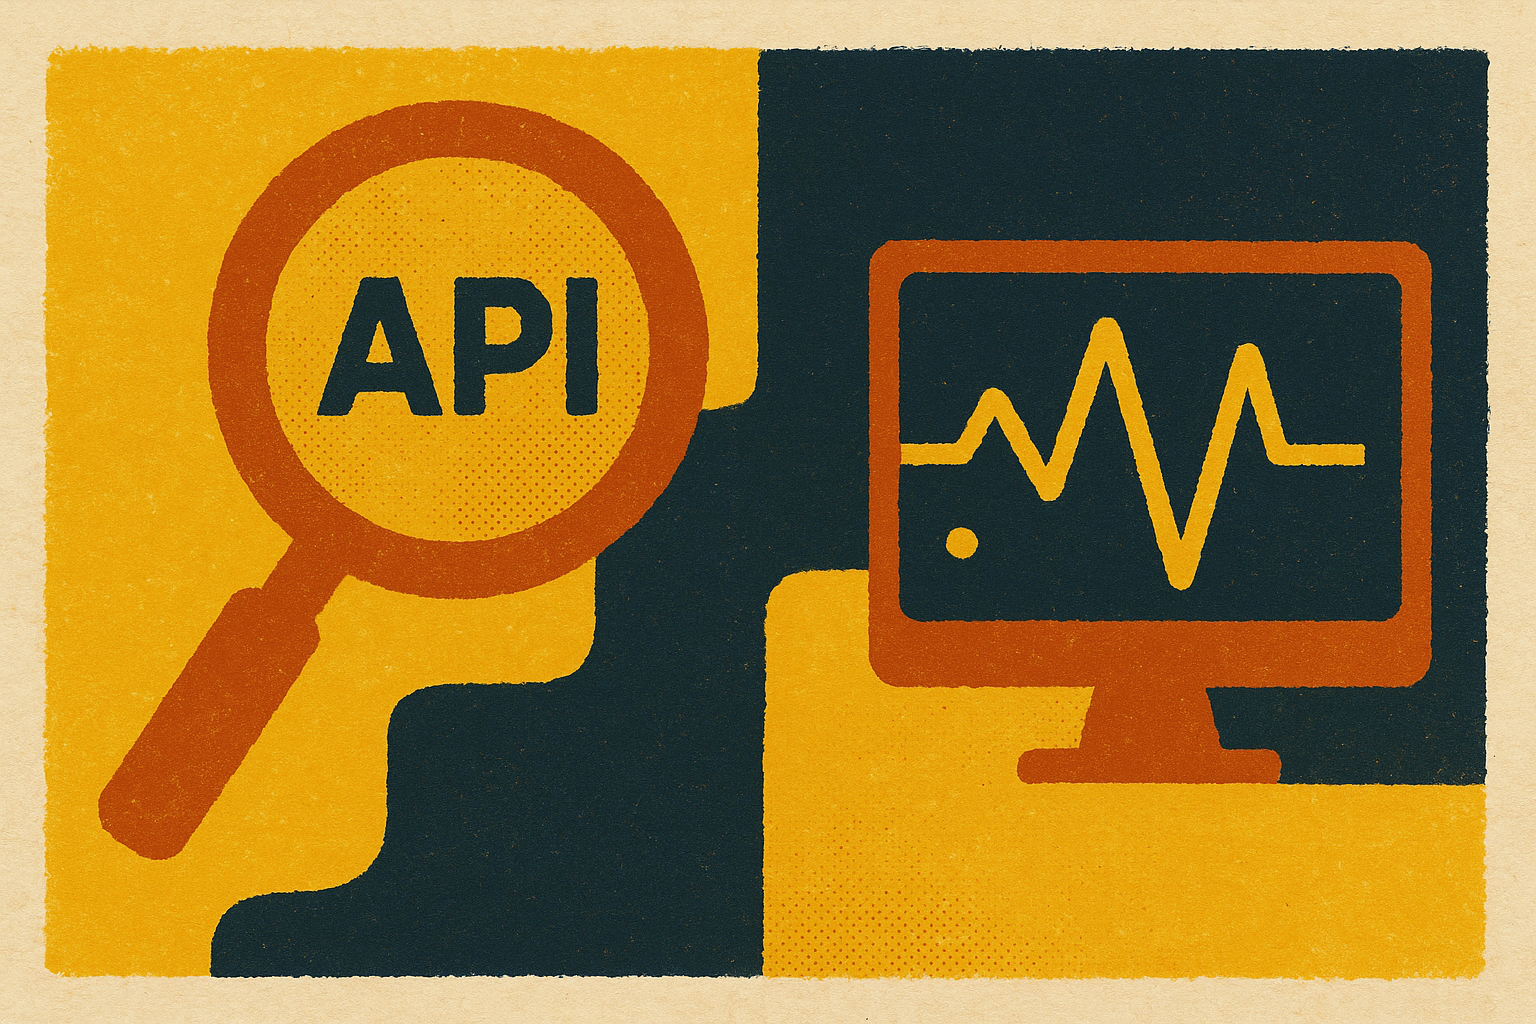
API monitoring and API observability get treated like synonyms, and that mix-up costs real money. Postman's 2025 State of the API Report, which surveyed more than 5,700 professionals, found APIs now underpin over 80% of digital transactions. At that scale, picking the wrong tool (or thinking you've covered your bases when you've only bought half of what you need) compounds fast. Monitoring tells you something broke. Observability tells you why. Those are different jobs, and confusing them is how teams end up staring at a red alert with zero idea where the fire actually started.
Picture two night-shift security guards at the same building. One watches a single monitor showing the front door, and every time it opens, a buzzer goes off. The other has access to every camera in the building, the guest logs, and a radio to every floor. The buzzer guard will always tell you something happened. The other guard can tell you what happened, where, and why the door was even unlocked in the first place. Most companies think they've hired the second guard. They've actually only hired the first one, and they're stunned when he shrugs at 3 a.m. and says, "Not my department."
What API monitoring actually does — and what it was designed for
Monitoring, per Postman's own API platform documentation, gathers, visualizes, and alerts on pre-defined metrics to check that an API meets specific expectations. That's the whole job, and it's a good one.
Here's how it works mechanically. A tool hits specified endpoints on a schedule, or gets triggered by a CI/CD event. It logs what comes back. If a threshold gets crossed, an alert fires: a 500 error, a timeout, latency creeping past whatever ceiling you set. This is blackbox testing, meaning the tool probes your API from the outside, the same way any consumer would. It doesn't know or care what's happening inside your services.
Monitoring is genuinely great at four things: latency, error rate, throughput, uptime. Each one is a crisp question with a yes-or-no answer.
- Is the API up?
- Is latency under 200ms?
- Are error rates below 1%?
Ask monitoring those questions and it'll answer them reliably, every single time. Ask it anything you didn't think to configure ahead of time, though, and you get silence. Novel failure modes, cross-service degradation, a single customer's weird edge case that never trips a global threshold: monitoring only sees what you told it to look for. It functions like a smoke detector rather than a fire marshal.
I once talked to an engineer who described her team's monitoring setup as "a very expensive way to find out things are on fire after the building's already gone." She wasn't exaggerating much. Their dashboard was green right up until the moment forty customers emailed support within the same ten minutes. The alert that should have caught it simply didn't know to look there. As she put it: "We had a monitor for everything we'd already been burned by. We just hadn't been burned by this yet."
What API observability adds that monitoring leaves out
Observability, again per Postman, is the extent to which you can understand an API's internal state through the signals it emits. Notice the shift: monitoring checks expectations, observability builds understanding.
The architecture is different too. Observability is whitebox. You install an agent or SDK that passively logs real traffic to an observability service, capturing what actually happened rather than what a synthetic test simulated. That's a meaningful distinction. Monitoring runs a script that pretends to be a user; observability watches the actual users.
This approach is good at catching "unknown unknowns," the failures nobody wrote a test for because nobody knew to look for them, including bugs that live in a consumer's integration rather than your own code. Zuplo's documentation lays out the contrast well. Monitoring asks, "Is latency above 500ms?" and gives you a yes or no. Observability asks, "Why did latency spike for customers in Europe but not the US?" and lets an engineer actually go dig, without needing to know the answer in advance. Or take a question monitoring can't even phrase: "Which specific policy in my request pipeline added 300ms to this endpoint?" There's no threshold to set for that. You just have to be able to look.
Here's a fair question for the room: what do you call an API failure nobody configured an alert for? A surprise party. Nobody sent invitations, nobody planned it, and yet the whole team shows up anyway, confused, at the worst possible hour.
Most API teams don't fully control how their API gets used. Consumers might be another team down the hall, a partner company, or some third-party developer you've never met. Observability catches the messy, half-broken integration patterns those consumers build, the stuff monitoring will never surface because it was never told to check for it. And where monitoring lives in the day-to-day, "did this pass or fail right now," observability leans toward trends and investigation over time.
The four signals that make an API observable — and how they work together
Observability rests on four pillars, collectively called telemetry: metrics, traces, logs, events. Each one answers a different stage of the same investigation.
Metrics are aggregated numbers over time: latency percentiles, error rates, throughput, payload sizes. They're the starting signal, the thing that says "something's wrong here" without saying what.
Traces follow one request end-to-end through a distributed system. They show exactly which services that request touched and how long each hop took. If metrics say something's wrong, traces say where.
Logs are the application and system records: a process starting, an error getting handled, a job finishing. Dynatrace frames logs as the context layer, filling in what the application's state actually was at the moment a metric got captured. Logs answer why, at that specific moment, things went sideways.
Events capture detailed request and response activity in real time, which matters most when a failure is intermittent or lives entirely on the consumer's side.
Put together, the sequence runs: metrics alert, traces locate, logs explain. Each pillar hands the baton to the next one, like a relay team where dropping any leg means nobody crosses the finish line. A team that only has metrics knows something's broken and nothing else. A team with metrics and traces knows where, but not why. You need all three to actually close the loop. Worth noting, Dynatrace includes user experience and security alongside the original three pillars in its observability definition, reflecting how far the concept has drifted from pure infrastructure signals.
What API failures actually cost when detection is slow
The numbers here aren't abstract, and they're moving in the wrong direction. Uptrends' State of API Reliability 2025 report found average API uptime fell from 99.66% to 99.46% between Q1 2024 and Q1 2025. That looks like a rounding error until you translate it: a 60% increase in downtime year over year, with weekly downtime climbing from 34 minutes to 55 minutes.
Now price that out. New Relic's 2025 Observability Forecast, which surveyed over 1,700 IT and engineering leaders across 23 countries, puts the median cost of a high-impact outage at $2 million per hour for organizations without full-stack observability. Organizations that have it see that median cut in half, down to $1 million per hour. Annualized, the median cost of high-impact IT outages reaches $76 million. That's a line item someone has to explain to a board.
Here's the part that should actually worry you: Industry data shows that 60% of API incidents go undetected until users experience the disruption themselves. Threshold-based monitoring, on its own, misses most problems before a customer ever notices. And the same New Relic forecast found engineers spend 33% of their time firefighting technical disruptions instead of building anything new. That's the direct tax of reactive-only tooling: less building, more putting out fires that a smarter setup would've caught earlier.
The detection lag baked into monitoring-only setups is exactly where all that outage cost piles up.
Where monitoring stops and observability must take over — in practice
Scenario one: routine health checks. Scheduled synthetic tests, uptime assertions, SLA compliance. Monitoring's got this. Observability adds nothing here that monitoring doesn't already do more cheaply.
Scenario two: a latency alert fires, no obvious cause. Monitoring tells you the breach happened. It cannot tell you which service in a chain of a dozen microservices is the culprit. That's where traces earn their keep, following the request hop by hop until they isolate the slow one.
Scenario three: a customer reports a failure, but no alert ever fired. This is the textbook unknown unknown. That customer's error rate never crossed a global threshold, so monitoring stayed quiet the whole time. Observability logs, though, captured the actual request and response for that one customer. The team can replay it, inspect it, and find the problem without ever having predicted it would happen.
Scenario four: a new API version ships. Monitoring tests the new endpoints against contracts you already wrote. Observability watches what real traffic does after deploy and flags usage patterns no synthetic test ever considered, because real users are far more creative (and far messier) than test scripts.
The pattern across all four: monitoring is rock-solid for questions you already wrote down ahead of time. Observability is what you need the moment a question shows up that nobody thought to ask.
Why the two approaches need each other to work
Run monitoring without observability, and you get fast alerts with no root cause; the team knows something broke and then burns hours guessing why. Run observability without monitoring, and you get rich telemetry that nobody looks at until a customer complains, because nothing's watching consistently in the background.
Monitoring supplies situational awareness, the steady always-on pulse check. Observability supplies depth, the full picture needed to actually fix something and stop it from happening again. New Relic's 2025 data backs up the payoff of running both: 68% of organizations report measurable improvements in mean time to detect after adopting observability, and 75% report a positive return on the investment.
Monitoring works like a smoke alarm; observability works like a fire investigator. You want both in the building; conflating the two means you either over-instrument routine checks with tools meant for deep investigation, or you under-equip yourself for a complex failure with tools meant for simple yes-or-no checks. Most teams start with monitoring, since it's cheaper to set up and pays off immediately, then layer in observability as the system gets more complicated. Microservices, third-party consumers, distributed deployments: those are the moments observability stops being optional and starts being the only way to actually see what's going on.
What a well-instrumented API stack looks like in practice
The foundation is monitoring: synthetic tests on a schedule across your critical endpoints, threshold alerts on latency, error rate, throughput, and uptime, plus tests triggered automatically on every CI/CD release.
The investigation layer sits on top: passive traffic logging through an agent or SDK, capturing real consumer requests rather than synthetic stand-ins; distributed tracing across every service a request passes through; structured logging tied directly to the specific trace and metric window it belongs to.
The part teams skip, and shouldn't: alerts from monitoring need to link straight into the observability layer. When a threshold trips, the on-call engineer should land directly in the trace view for that exact time window, not in a dashboard they then have to manually cross-reference against three other tools at 2 a.m.
That's what "full-stack observability" actually means in practice: metrics, traces, and logs unified so nothing requires manual stitching together. New Relic's 2025 data shows the payoff is real: organizations with full-stack observability see their median outage cost cut in half compared to those without it. OpenTelemetry is a vendor-neutral instrumentation standard worth knowing about if lock-in worries you, since it separates the instrumentation itself from whatever storage and visualization layer you plug in on top.
The real signal that your instrumentation is working: an engineer can answer "why did this request fail?" without writing a brand-new test and without waiting around for the failure to happen a second time.