API Error Rate Analysis and Root Cause Patterns
Identifying which structural patterns cause most API failures speeds up diagnosis and fixes.
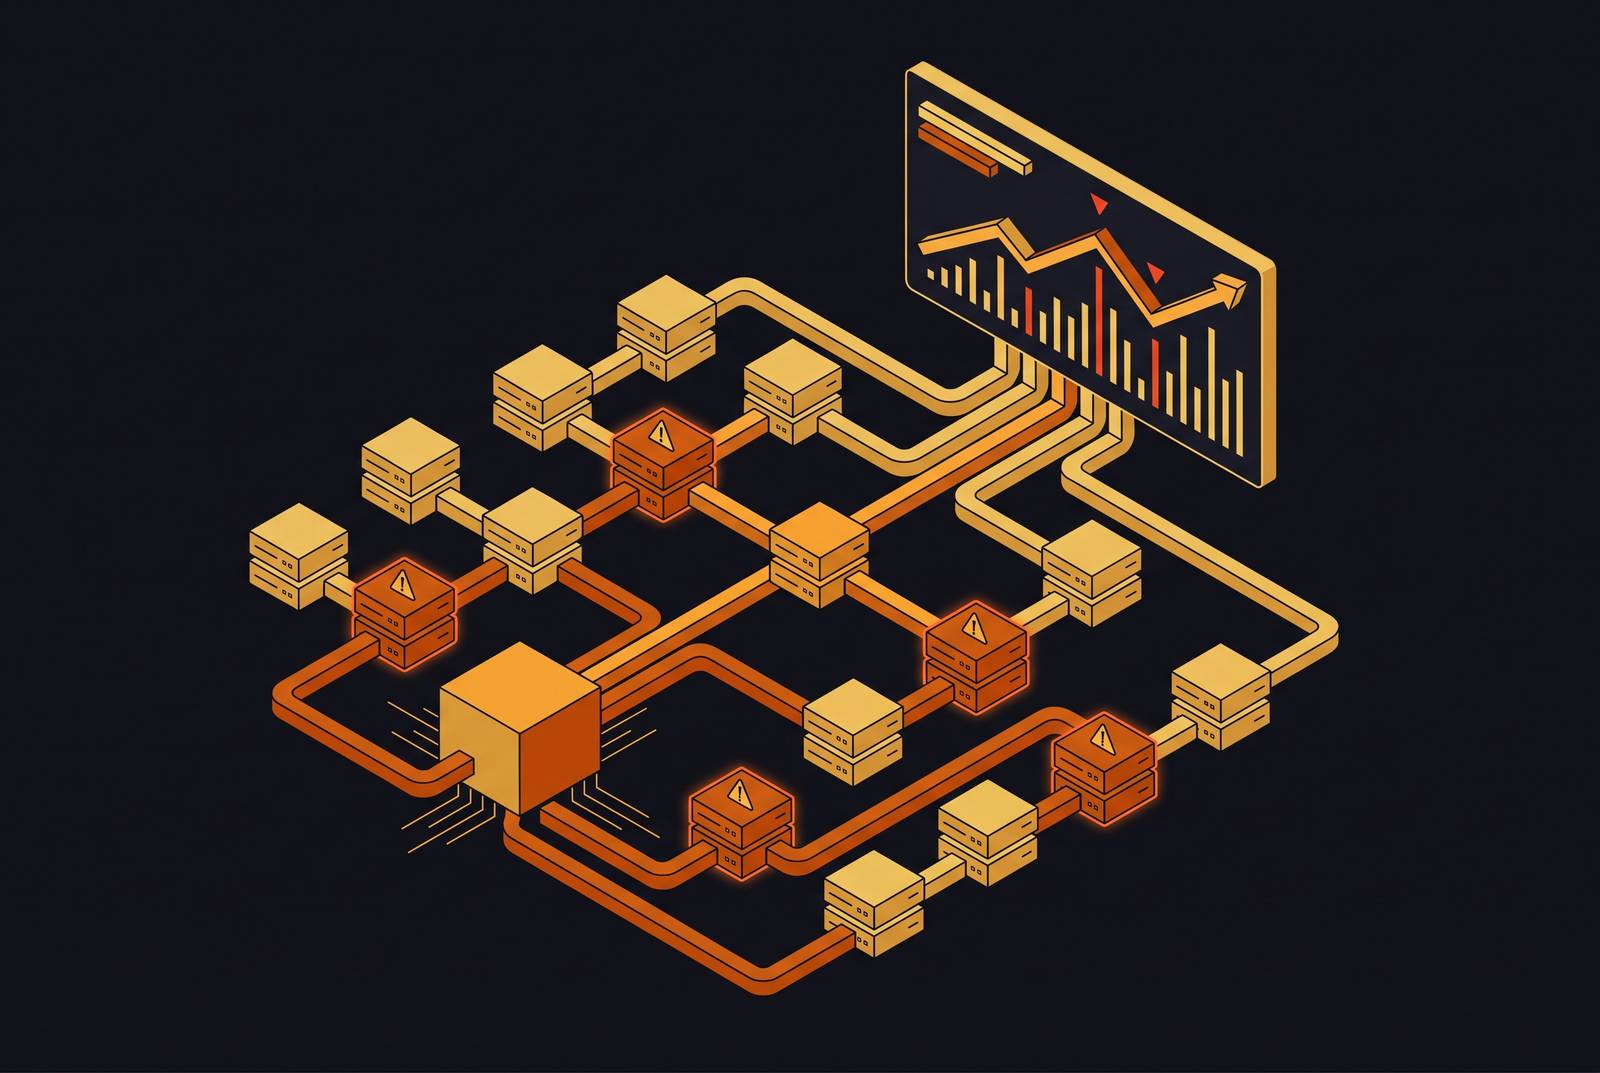
When an API error rate spikes, most monitoring dashboards can confirm that something broke and show you a count of how many times it broke. What they cannot do is tell you why it broke, which upstream dependency failed first, whether the failure originated in client behavior or server logic, or whether the same structural problem has been quietly recurring for weeks under different error codes.
That gap between detecting a spike and understanding its cause is where most incident response efforts stall out. This piece is about closing that gap by moving from raw failure counts to recognizing the handful of structural patterns that produce the majority of recurring API failures, and building a diagnostic workflow that connects those patterns to fixes that actually hold.
What the 4xx and 5xx Split Tells You
A 4xx means the request itself was wrong: bad syntax, missing auth, no permission, too many calls too fast, or asking for something that doesn't exist. The fix sits with the client. A 5xx means the server could not process a request that was structurally valid, whether from overload, an unhandled exception, an upstream dependency that didn't respond, or a maintenance window that wasn't flagged. The fix sits with the server.
That line gets muddy in practice, and the muddiness is itself useful information. If a server returns a 500 for a request that should have been rejected as a 400, the server tried to process malformed input instead of catching it at the validation layer. That is a meaningful bug, and it tells you exactly where to look next.
Volume alone won't get you there. A spike in 5xx errors is a categorically different diagnostic problem than a spike in 4xx errors, and treating them identically on a dashboard buries the signal. Real distributions make the point: on report endpoints, a large share of errors appear as 500 Internal Server Error; during search API failures, a significant portion land as 503 Service Unavailable; during regional outages, 5xx errors can spike to nearly half of total traffic. Three different shapes, three different root causes. The first diagnostic question, before anything else is touched, is which side of the boundary owns the failure. Everything downstream depends on answering that correctly.
Four Structural Patterns Behind Most Failures
Pull enough incidents apart and four categories keep appearing, each with its own signature and its own resolution path.
Authentication and contract failures sit on the 4xx side. Bad inputs, broken client logic, expired or malformed auth keys, and mismatches in request structure all fall here. The fix requires strict input validation, error messages that give the client enough information to correct the request, and contract agreements between teams that are actively maintained rather than written once and ignored.
Configuration and setup failures are quieter but more damaging, because they hide in places nobody routinely audits: environment variables, file paths, install scripts, and documentation that quietly references the wrong setting. The 2023 Aliyun outage, which ran 185.76 minutes, traced back to a whitelist contamination issue in an access key component. The 2024 Google Cloud disruption affecting UniSuper lasted seven days and affected approximately 620,000 members, also attributed to configuration faults. Authentication failures that cluster around deployment windows are a reliable early indicator of this pattern.
Performance drift and resource exhaustion is the pattern that matters most by sheer frequency. It surfaces as timeouts, memory ceilings being hit, loops that never terminate, and recursion that never bottoms out. An estimated 70% of API incidents trace back to performance drift that went unmonitored long enough to become a visible spike, meaning most of these failures were detectable well before they escalated. Addressing this pattern requires retries with graceful failure behavior, load testing before launch, disciplined caching, and backend observability that tracks trends rather than just threshold crossings.
Dependency cascades and rate limit exhaustion occur when one weak component takes down the services connected to it. The 2023 ChatGPT outage lasted roughly ninety minutes and came from system overload driven by usage that exceeded what the infrastructure was built to handle. The 2021 AWS outage, which lasted more than eight hours, was triggered by an automated scaling process that caused a surge in connection activity and overwhelmed the network. Multi-carrier shipping integrations illustrate the same pattern at smaller scale: UPS and DHL each throttle differently using error-code-based limits and endpoint-specific rules, and when multiple carriers throttle simultaneously during peak volume, rate-limiting strategies built for one carrier provide no protection against another. Resolving this pattern requires quota planning, exponential backoff, health checks on every dependency, and a normalization layer that translates each upstream system's throttling signals into a single internal metric.
How Correlation Reveals Patterns Error Counts Hide
Errors do not happen in isolation. A database connection error tends to coincide with a memory spike. Auth failures cluster around deployment times. Third-party errors often align with upstream maintenance schedules. None of that is visible if the only thing being tracked is a raw count.
The distribution of errors over time is the diagnostic tool. Errors scattered randomly across time generally point to intermittent infrastructure trouble in the network or hardware layer. Errors that cluster around specific times or specific user actions generally point to a logic bug or a resource contention problem, where one part of the system is competing with another for the same resource.
A detail that causes persistent problems: a 200 OK response does not confirm the system worked correctly. The payload can be empty. A schema field can have changed without notice. Auth can have partially failed. An upstream service can return incomplete data wrapped in a status code that indicates success. Response code alone tells you nothing about whether the operation completed as intended, which means effective monitoring must check the entire request chain, covering DNS resolution, the TCP handshake, SSL negotiation, the request itself, and the response body, and log exactly where in that sequence something broke. Assertions need to verify actual field values, not simply confirm that a response was returned.
OpenAI's public status dashboard from 2024 illustrates what useful clustering looks like: 11 incidents in January, 14 in February, a jump to 34 in March, back to 17 in April, 24 in May, 112 total across the year. That March spike is a genuine signal that month-over-month correlation analysis exists to surface.
Alerting Strategy Either Supports or Undermines Diagnosis
Alerting on every individual 5xx error produces noise that overwhelms the signal, particularly in systems with automated retries or fallback logic already in place. Most of those individual errors resolve before a human needs to act on them.
A more effective approach is to set the threshold on requests per minute returning a 5xx error, rather than on individual failures, while maintaining a running tally of errors that fell below the threshold so the pattern can be addressed before it grows large enough to breach an SLA.
Enterprise contracts make the stakes explicit. SLA terms commonly specify availability at 99.9%, p95 latency under 200ms, and error rates below 0.1%, with financial penalties attached to violations. Alerting thresholds need to be calibrated against those contractual floors, not just adjusted to reduce alert volume for its own sake.
Miscalibration runs in both directions. Thresholds set too low generate false alarms that erode trust in the alerting system. Thresholds set too high allow the performance drift pattern, which is responsible for the majority of incidents, to breach SLA before anyone detects it. Alerting strategy is not separate from root cause work. It determines which patterns get caught early and which ones are only discovered after they have already propagated through multiple dependent systems.
What Automated Detection Catches and Misses
Machine learning for anomaly detection, log parsing tools like ELK or Splunk, dependency maps for understanding service relationships, and event correlation for linking related failures are now standard components of automated root cause analysis.
Datadog's 2025 benchmark placed its machine-learning-based anomaly detection at a 93% true positive rate with a 4% false positive rate on API traffic. Rule-based systems in the Moesif and Kong category land at 78% to 85% true positive with 10% to 18% false positives. That accuracy gap looks manageable until volume enters the picture. Forrester's research notes that at over a billion calls per month, a 10% false positive rate translates into thousands of unnecessary alerts per day, each one consuming human attention that would otherwise go toward genuine incidents.
Automation gets you to the alert faster. It does not identify which of the four structural root cause categories applies to the current failure, and that determination still requires judgment built on the diagnostic framework rather than an output an algorithm produces automatically. The teams extracting real operational value from automated detection are those who have closed the loop between detection and structured response, not those who have simply added another monitoring layer.
LLM-Based Root Cause Analysis in Microservices
Microservice architectures make root cause localization harder because a fault in one small component can propagate through a dozen loosely connected services. Misidentifying which service is responsible for the originating fault extends recovery time and causes SLA metrics to continue deteriorating while the team investigates the wrong component.
A newer class of LLM-driven root cause analysis tools addresses this with a two-stage approach: grounding first, which involves systematically observing what actually happened before drawing conclusions, followed by verification, which checks the proposed diagnosis against the collected evidence rather than accepting the model's initial output. One research prototype improved localization accuracy measured as Acc@1 from 43.5% to 52.5%. That improvement is real, but accuracy in the low fifties also means that human review of every diagnosis remains necessary before any remediation action is taken.
A 2025 case study on a cartservice fault shows how the reasoning trace works in practice: trace analysis flags three pods showing errors, metrics analysis identifies a response time spike to 97,246 milliseconds at the moment of fault, a log search surfaces 40 errors at peak, APM analysis records a 23.12% error ratio at 18:10, and the system produces a structured diagnosis connecting those observations. Current research frameworks evaluate these agents on three criteria: whether the correct entity was identified as the source of the failure, whether the fault type was correctly classified, and whether the reasoning is grounded in evidence rather than superficially plausible but unsupported. LLM-based root cause analysis handles multiple telemetry sources simultaneously in a way rule-based systems cannot match architecturally, but accuracy in the low fifties means every output still requires a human reviewer before anyone acts on it.
Connecting Patterns to Fixes That Actually Hold
Each of the four structural patterns requires a distinct resolution approach rather than a shared incident response script that treats all failures as equivalent.
Auth and contract failures require tight input validation, error responses that give the client enough information to correct the request, and contracts that are actively reviewed across teams rather than written once and left unchanged. Configuration failures require documented change history, an audit trail from the originating signal through to the decision made, and validation logic integrated into the deployment pipeline itself. Performance drift requires load testing before problems appear in production, disciplined caching, and resource monitoring that surfaces trouble before limits are breached rather than after. Dependency cascades require quota planning, exponential backoff, a normalization layer for upstream signals from systems that use incompatible formats, and degradation behavior that fails gracefully rather than propagating the failure downstream.
A fix that gets a service running again without identifying the structural pattern behind the failure is a temporary patch. Error clustering behavior confirms whether a fix addressed the root cause: if errors return to a random distribution after the fix, the structural cause was resolved. If clustering persists, the diagnosis was incomplete.
That means tracking the distribution of error types over time, not just the aggregate rate. The ratio of 4xx to 5xx errors and the specific codes that cluster together carry diagnostic information that aggregate counts do not. Reliability targets, error rates below 1%, response times under 200ms, uptime at 99.9%, are the standard against which any proposed fix gets measured. If those numbers do not improve after a fix is applied, the structural problem is still present.
Classify by which side of the boundary owns the failure. Identify the structural pattern. Correlate against time and behavioral context. Close the loop between detection and response. Validate against the error distribution, not just the rate. That sequence is what distinguishes teams that stop seeing the same incident recur from teams that have only become faster at responding to the same underlying problem.
Sources
- Root Cause Analysis Method Based on Large Language Models with Residual Connection Structures
- API Error Rate Analysis: Understanding and Reducing API Failures
- Quick overview — 4xx vs 5xx errors | by Bibek Sitaula | Medium
- 10 Most Common API Error Codes (and How to Fix Them in 2026)
- stackgen.com
- cncf.io
- totalshiftleft.ai
- arxiv.org