Distributed Tracing for API Integration Pipelines
Traces reveal where requests actually slow down by tracking each service boundary separately.
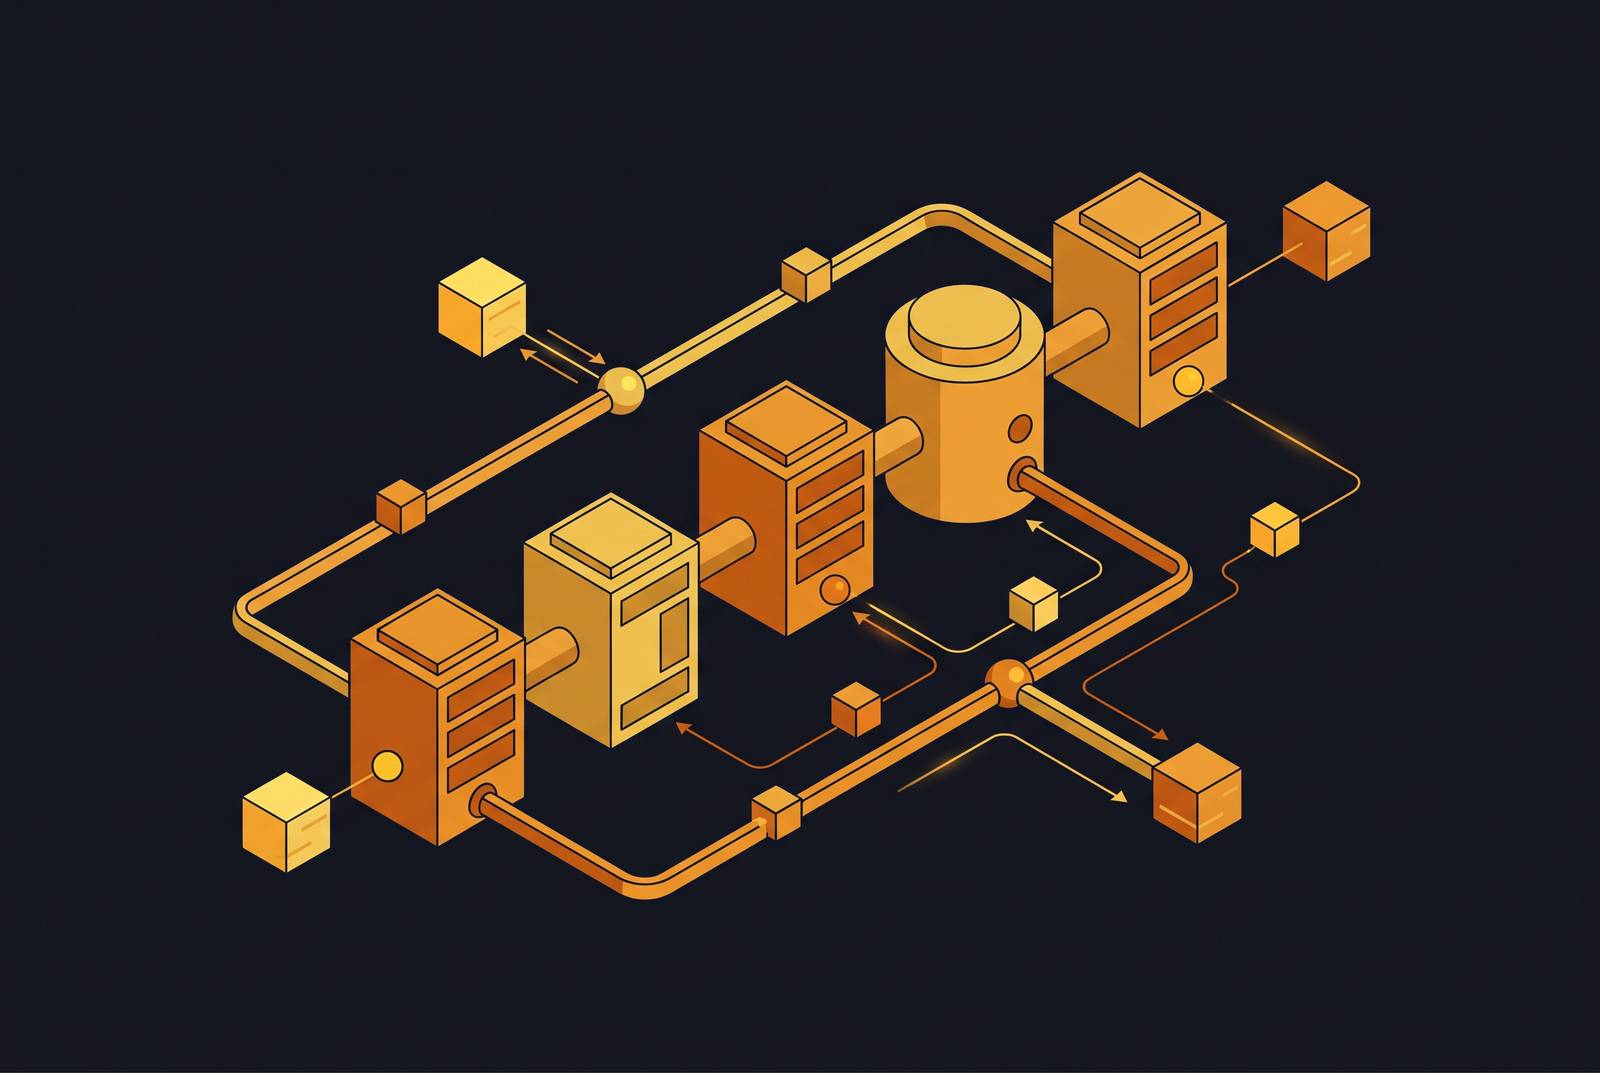
Tracing is not a fancier log, and treating it like one is the first mistake most teams make. A request through an integration pipeline might hit an HTTP gateway, land on a message broker, get picked up by a gRPC service, hit a SQL database, and finish in an object store before it ever answers the caller. A trace is the full record of that trip, not a line describing it after the fact.
Each leg of the trip is a span: one query, one HTTP call, one message publish. Every span has a start time, an end time, and a parent, and that parent-child link is what lets someone rebuild not just what happened, but the order it happened in and how long each piece consumed. A trace ID ties the whole thing together, a single tag every span in that journey carries so the backend knows they all belong to the same request. Lose that ID somewhere along the way, and you get orphan spans with no idea which request they belong to.
The parent-child model shows the real bottleneck, and it is rarely the one people guess. Average latency lies. Tail latency, the 95th percentile, is where the actual damage hides, because a request that breaks into four to seven segments across services and data stores only reveals its slow segment once you can see each one separately.
Metrics tell you the system's current state. Logs tell you an event happened. Traces tell you the journey one request took. None of the three replaces the other two, and picking one as a single source of truth is how teams end up debugging blind.
How trace context crosses protocol boundaries
HTTP solved this problem years ago. Trace context rides in a header, the W3C Trace Context standard's traceparent, and any language or framework reads it the same way.
Everything else in the pipeline is where the real work lives, and where most tracing gaps actually start. gRPC needs trace context stuffed into metadata. AMQP brokers need it carried in message headers. JDBC calls need their own path entirely. Every protocol boundary is its own adapter problem, and context gets dropped or mangled exactly at those seams, not inside any one service.
Use W3C Trace Context for HTTP and gRPC, since both support it natively. Build small adapters for AMQP and JDBC instead of treating message queues like a black box. When some legacy downstream service cannot accept upstream trace context, generate a synthetic ID and stitch the lineage back together later through a correlation store. Cap baggage at a modest size: a user ID, a tenant ID, a correlation key or two, and maybe a feature flag. Adding more than that compounds network and storage costs quietly until they become visible on a bill. Service meshes can carry a significant portion of this propagation at the infrastructure layer, which reduces the burden on individual services.
Sampling strategies that control tracing costs
Trace everything all the time, and two things happen: the bill jumps, and the rare events that actually mattered still slip through. More data does not automatically mean more signal.
The fix runs on two layers. Head-based sampling picks a fixed rate for ordinary traffic, just enough to keep data growth manageable, while guaranteeing a minimum trace rate on each critical path. Tail-based sampling waits to see if a trace shows elevated latency, an error spike, or an unusual pattern of lookups, and only then retains it regardless of what the base rate says.
The correct sequence is to watch trace volume first, set explicit targets for retention and completeness, and only then tune rates. Reversing that order means every later decision is made without a reliable baseline.
Which spans to instrument first
Not every span deserves the same attention. Start at the boundaries, the places most likely to quietly wreck a request without surfacing an obvious error.
Outbound calls to external APIs need the HTTP verb, endpoint, status code, and response time. Messages published or consumed need the queue name, message ID, and time-in-queue, since the gap between publish and consume is where latency hides. Database interactions need operation type, target table, and duration, kept coarse enough that high-cardinality keys do not overwhelm the backend.
Authentication and authorization steps deserve their own spans because a failure there tends to surface two or three services downstream as something that looks completely unrelated to login. Retry and circuit-breaker events need their count and reason recorded, since those are early indicators of an outage rather than background noise.
Per span, the fields that matter are response time, status code, HTTP verb where it applies, content type, and a correlation ID that survives the whole request. OpenTelemetry SDKs allow up to 128 attributes per span by default, but a small, consistent set applied the same way across every span does more diagnostic work than an exhaustive list applied inconsistently.
GitLab makes the stakes concrete: running over 100,000 pipelines a month means a one-minute shift in execution time adds or removes roughly 2,000 hours of work across the organization, something like 87 extra days. At that scale, span-level timing on CI/CD jobs is a budget line item. Tracing pointed at the deployment pipeline itself also catches performance regressions before they reach production.
Why the ecosystem converged on OpenTelemetry
OpenTelemetry graduated as a CNCF project in May 2026, the formal signal that it is the standard for collecting telemetry. It was accepted into CNCF in May 2019, moved to incubation by August 2021, and graduated seven years after it started.
Vendor-sourced OTel distributions are gaining ground alongside teams building their own collectors from scratch, which points toward managed OTel becoming an increasingly common setup. The reason enterprises cite most often for adopting it is vendor neutrality: the instrumentation code stays put no matter which backend ends up storing the traces.
Inside an integration pipeline, that neutrality produces a few concrete capabilities. A unified Collector takes spans from all kinds of sources and routes them to multiple backends simultaneously. Auto-instrumentation libraries cover standard HTTP, gRPC, and database calls without requiring hand-written boilerplate. Native W3C Trace Context propagation comes built in, and the Collector pipeline supports flexible sampling configuration. The backend becomes a decision that can change later without touching instrumentation code.
How to choose a tracing backend
Every major open-source backend speaks OpenTelemetry natively, so the choice comes down to storage model, query capability, ecosystem fit, and cost. Choosing based on name recognition rather than storage model is the most common way teams end up with a surprise bill a year later.
Jaeger shipped version 2.0 in November 2024, rebuilt around OpenTelemetry at its core. Jaeger v1 hits end-of-life December 31, 2025, with no releases after that date. Teams still on v1 need a migration plan now. Jaeger fits setups that need adaptive sampling and support for more than one storage backend.
Zipkin is still maintained through 2025 with security patches, mostly on volunteer effort. It is a good choice when the goal is getting a simple pipeline traced quickly and low operational overhead matters more than advanced sampling controls.
Grafana Tempo requires only object storage to run, which makes it the cheapest open-source option at scale. It correlates natively with Grafana dashboards, Prometheus metrics, and Loki logs, with trace-to-metric and trace-to-log pivots built in. It is the best fit for teams already working inside the Grafana ecosystem.
Honeycomb is built around high-cardinality querying, the kind of dimension-heavy analysis that would overwhelm a traditional time-series backend. It fits teams where interactive, exploratory debugging is a core part of the workflow.
Splunk, under Cisco since a $28 billion acquisition in March 2024, carries a Gartner Leader label for Observability Platforms. Its NoSample technology captures every trace without dropping events, which matters for compliance-heavy pipelines where full auditability is required. It fits enterprise environments that want full-fidelity capture alongside security tooling on one platform.
Dynatrace targets enterprise-scale deployments using AI-driven discovery and monitoring. The tradeoffs are a higher subscription cost and less flexibility for custom backend routing compared to an OTel-native setup. It fits organizations that prefer buying automation over tuning configuration manually.
Datadog holds roughly 24% of the APM market, Dynatrace 14%, New Relic 8%, Elastic 6%. All four ingest OTel, so the instrumentation choice does not lock a team into any one of them. The decision should be based on storage cost tolerance, the existing ecosystem, and whether full-fidelity or sampled capture matches the actual compliance and debugging requirement.
A practical instrumentation sequence for new pipelines
Start with the two or three request flows where a failure costs the most, such as checkout, data ingestion, or authentication, and instrument those end-to-end before touching anything else.
Deploy the OTel Collector as a gateway early. Configure it to receive spans from every service and route to the chosen backend, keeping instrumentation and backend decoupled so the backend can change later without requiring a rewrite. Instrument service boundaries first: every outbound call, every inbound receive. Internal function-level spans can be added later once the boundary picture is complete, because adding them prematurely means redoing the work.
Document propagation contracts for every protocol in the pipeline, specifying exactly which fields carry trace context for HTTP, gRPC, AMQP, and JDBC. A propagation failure should fail a test, not surface unexpectedly in production. Set sampling policy before launch: agree on the head-based rate for normal traffic, agree on the tail-based rules for catching anomalies, and observe actual trace volume for at least a week before adjusting either one.
Connect every trace to logs and metrics by ensuring the trace ID appears in log entries, so an engineer can jump from a trace directly into the log context for that exact span. Then measure mean time to resolution before and after rollout, since that number is what justifies the project to stakeholders.
The failure mode worth preventing is inconsistent instrumentation: one team wiring up traces one way, another team doing it differently, and nobody able to compare across services because the schema was never standardized. Trace propagation on critical paths deserves the same review discipline as authentication or error handling. It should be treated as a required standard, not an optional enhancement.