OpenTelemetry Setup for API-Heavy Applications
Span volume, context loss, and sampling rules break most OpenTelemetry setups for APIs.
API-heavy applications break OpenTelemetry setups in three predictable spots: span volume balloons, context gets lost between services, and sampling rules end up either too cheap or too blind to be useful. This piece is built around those three pressures, because generic instrumentation walkthroughs mostly ignore them.
Most OTel guides treat a monolith and a 40-service API mesh as the same problem. They're not. An app that makes a dozen outbound API calls per request, each one hitting a different downstream service, produces a trace volume that a simple database-backed app never sees. And the fixes that work for the simpler app (100% sampling, default Collector config, head-based decisions) fall apart fast once request rates climb.
The Grafana Observability Survey from 2026 backs this up in a roundabout way. Traces sit with roughly half of respondents using them, metrics lead at 57%, and profiling, the newest signal, sits at just 9% adoption. Teams are still getting the basics right. They're still getting the basics right. That's the sane order of operations, and it's the order this piece follows too: volume, propagation, sampling, in that sequence, because each one sets up the next.
What OpenTelemetry gives you before you write a line of configuration
Strip away the marketing and OpenTelemetry is a vendor-neutral framework: APIs, SDKs, and a Collector that handle traces, metrics, and logs. Instrument once, send the data wherever you want. That's the whole pitch.
For an API-heavy service, the three signals split up cleanly:
Traces follow one request across every hop it takes. Each hop becomes a span with a start time, an end time, a status, and whatever attributes got attached. Metrics aggregate the numbers, request rates, error counts, latency spread, across the whole fleet, not just one request. Logs are structured event records tied back to trace and span IDs, so a log line is never orphaned. You can always find the trace it belongs to.
The part that actually matters for API stacks: before OpenTelemetry, a vendor SDK got baked into every service. Switch backends, and every service needs re-instrumenting. OTel decouples that. The instrumentation stays put, the backend is just a routing decision.
As of mid-2026, traces and metrics are stable across every major language SDK, safe to build production alerting on without worrying about breaking changes. Logs are stable in spec and in several SDKs, but not all of them. Go's log SDK hit release candidate in August 2026 and hasn't gone stable yet. Profiling entered public alpha in March 2026, so it's not a production signal, and treating it like one would be a mistake.
The project itself hit CNCF graduation in May 2026, with over 12,000 contributors from more than 2,800 companies. Second-highest project velocity in the CNCF ecosystem, behind only Kubernetes. None of that matters if the overhead is bad, and CPU overhead is reported at under 1%. eBPF-based auto-instrumentation runs similarly light, under 1% CPU, around 250MB memory. Instrumentation isn't the expensive part. What you do with the data afterward is where the budget disappears.
Choosing an instrumentation approach before touching the Collector
Before any Collector config gets written, there's a more basic choice: auto-instrumentation, manual instrumentation, or some blend of the two. Most teams start with auto and layer manual on top, and that's the right order.
Auto-instrumentation is the default starting point because it's fast. For Node.js, the @opentelemetry/auto-instrumentations-node package traces HTTP calls, database queries, gRPC, and message queues without touching application code. Python's opentelemetry-instrumentation package covers the same ground. Java split into two paths back in September 2024: the Java agent, attached at startup with -javaagent, gives the broadest coverage but adds startup overhead and can't run with Spring Boot Native. The Spring Boot Starter, which reached general availability that same month, supports native image builds and configures through application.properties or YAML, with a lighter startup cost.
Auto-instrumentation reportedly cuts manual instrumentation work by something like 80%. But it only sees infrastructure behavior. It catches http.request.method and db.system. It has no idea what order_id or payment_method or customer_tier means to your business, and those are exactly the attributes that separate a failed payment trace from a slow search query.
eBPF-based auto-instrumentation deserves a separate mention: zero code changes, wide language coverage across C/C++, Go, Rust, Python, Java, Node.js,.NET, and Ruby, plus kernel-level visibility that agent-based tools can't reach. Useful for services where nobody wants to touch the code, for good reason or bad.
Manual instrumentation isn't optional once business context matters, and in API-heavy stacks, it always does. Parent-child spans handle sequential call chains fine, but fan-out calls, batch jobs, and async messaging don't fit a strict hierarchy. Span links are the right tool there. Wide events, sometimes called canonical log lines, should be built deliberately, with one structured event per request per service, carrying user context, business metrics, infrastructure details, and error info all in one place. That turns debugging into a query instead of a grep session, but it's a choice someone has to make. Auto-instrumentation won't hand it to you.
For a Python Flask service, the concrete package list looks like this: opentelemetry-api, opentelemetry-sdk, opentelemetry-instrumentation-flask, opentelemetry-instrumentation-requests, opentelemetry-exporter-otlp-proto-http. And for teams running multiple services, OTel now supports YAML and JSON config files, so configuration doesn't have to live entirely in scattered environment variables.
The pattern that actually works in production: roll it out in phases. Auto-instrumentation first, for coverage. Manual spans added service by service, as business context gets identified. Nobody sane tries to do this as one big migration.
The Collector's handling of the span volume that API-heavy services generate
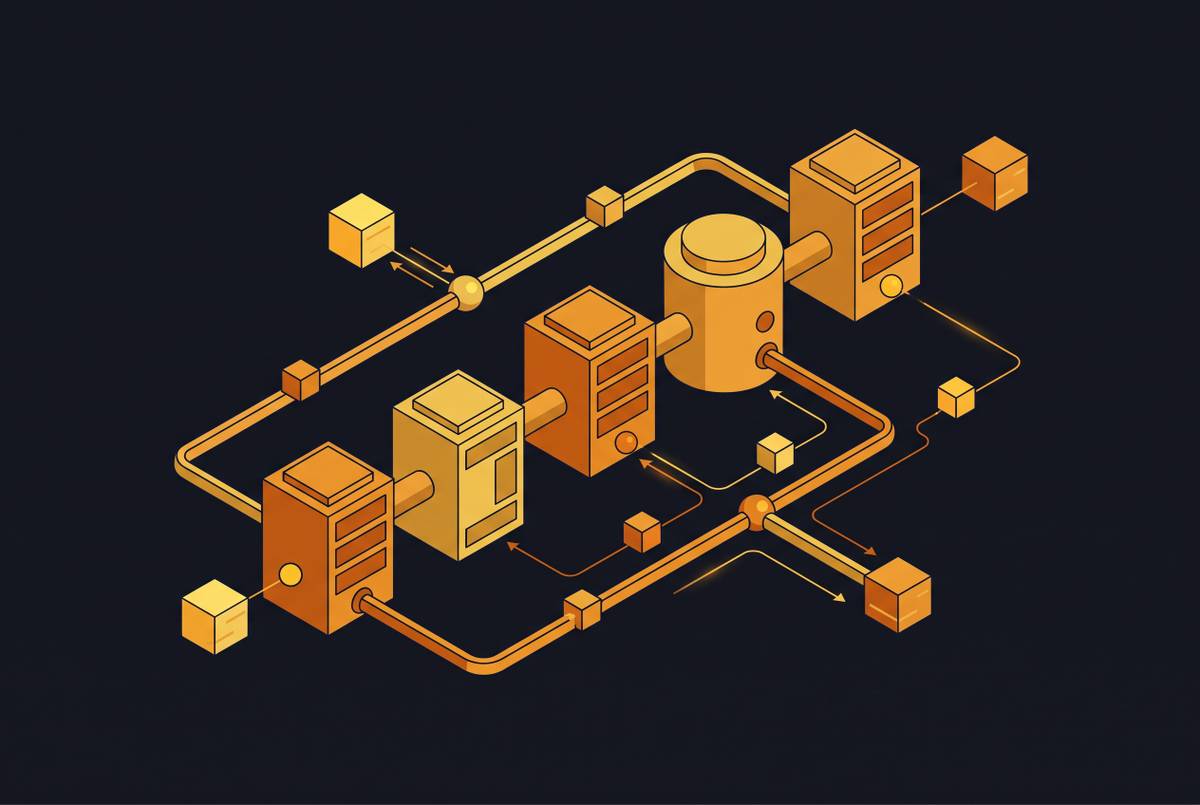
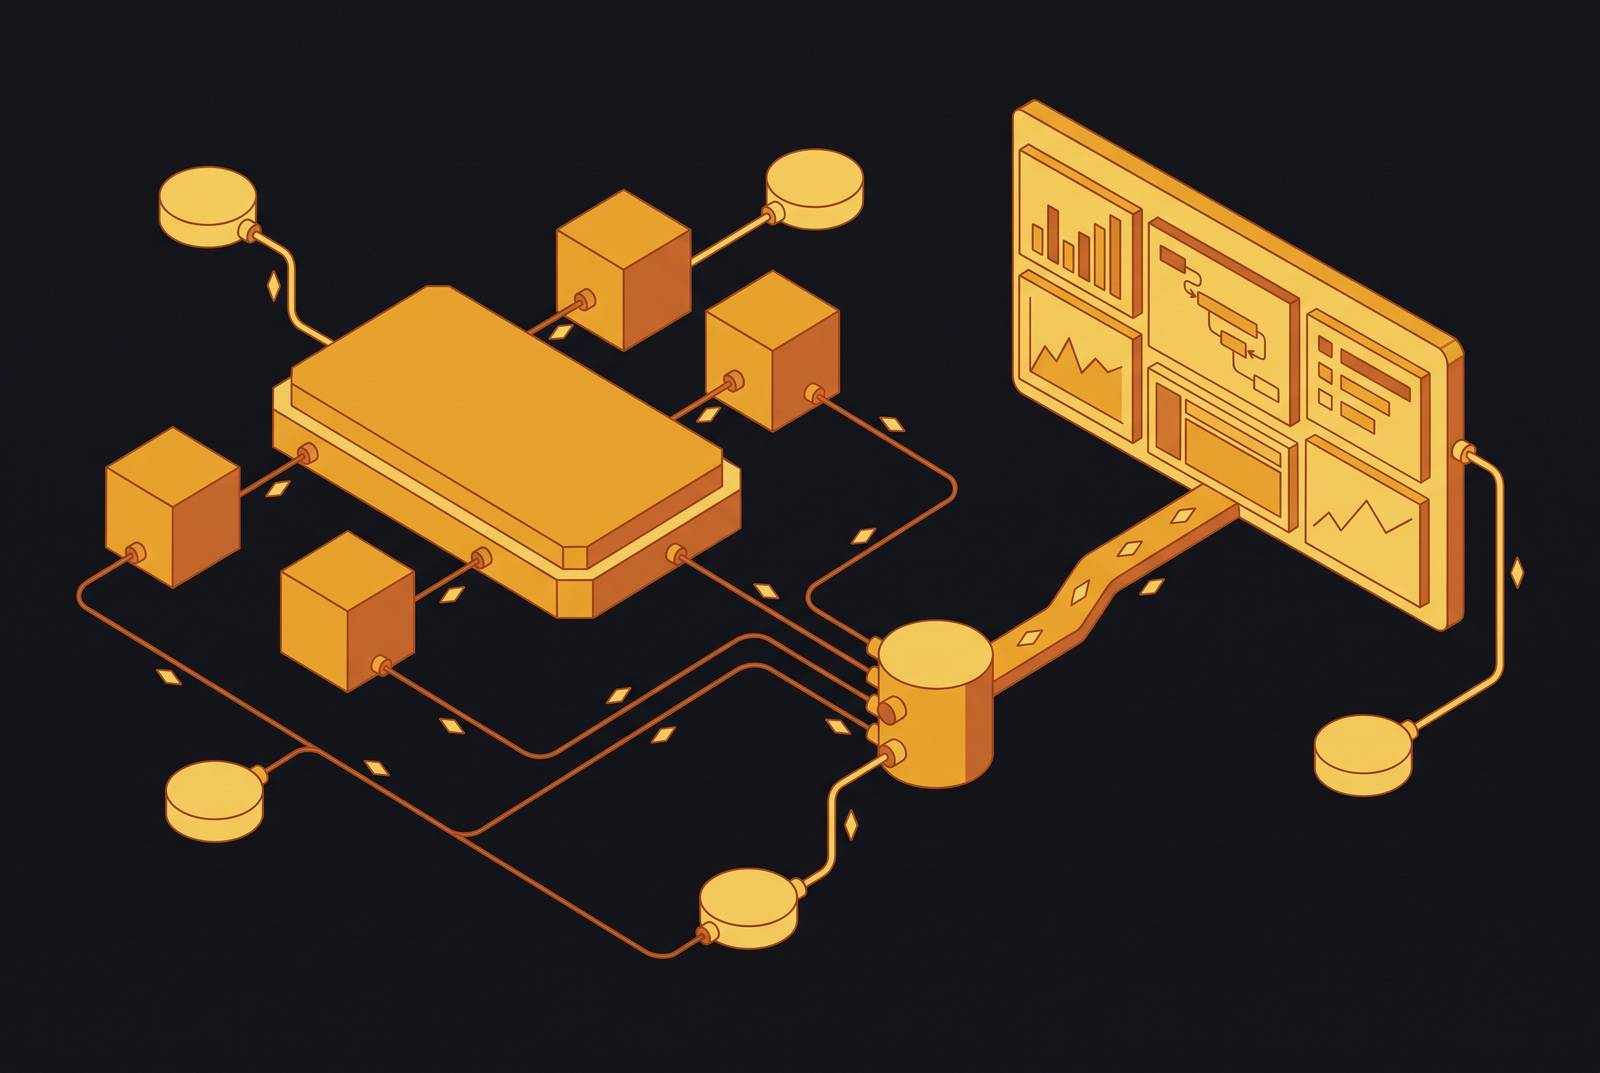
The Collector sits between every instrumented service and every backend. It's a vendor-neutral proxy: receive, process, export. One pipeline instead of a separate agent bolted onto every tool.
It's the most important production component in the whole setup, because it absorbs work the application shouldn't be doing itself: batching, retries, sampling, format translation.
Four processors matter most at high span volume. The Batch Processor groups spans before export, cutting down connection overhead when span rates spike. The Memory Limiter Processor caps memory use so a traffic surge doesn't crash the Collector with an out-of-memory error, though a Collector follow-up survey found adoption of this processor actually dropped between survey rounds, a gap that deserves flagging rather than ignoring. That gap deserves flagging. The Attributes Processor adds, edits, or strips attributes, useful for enforcing consistent naming across services and for cutting high-cardinality attributes before they hit storage and blow up the bill. The Tail Sampling Processor waits until every span in a trace has arrived before deciding whether to keep it, which is the mechanism that keeps errors while shedding routine noise (more on that below).
On Kubernetes, two deployment patterns cover most cases. A DaemonSet runs one Collector per node, capturing node-level telemetry with a short hop from application to Collector. A Deployment, run as a gateway, centralizes collection for cross-cluster work and tail sampling.
Tail sampling at scale usually needs two tiers. Tier 1 uses a load-balancing exporter to route every span belonging to one trace ID to the same Tier 2 instance, so the tail sampler actually sees the whole trace instead of fragments. Tier 2 applies the sampling policy once it has the complete picture. Multi-cluster setups push this further: spoke-cluster Collectors export to a central gateway, and tail sampling runs there, since that's the only place with visibility across cluster boundaries.
Serverless functions on AWS Lambda or Google Cloud Functions don't fit the DaemonSet model at all, since they're not running inside a cluster. Those export OTLP straight to a gateway endpoint instead.
None of this is free of friction. In the Collector follow-up survey, 63% of OTel users flagged configuration management as the area most needing work, 52% flagged stability, and 43% wanted better observability into the Collector itself. Collector complexity is an ongoing operational job that requires continuous attention beyond a box you check once during setup.
Sampling decisions that keep error visibility without bankrupting your observability budget
A gaming company cut its observability bill in half using tail sampling, keeping every failed request and every critical trace while sampling down the routine traffic. No signal lost, half the cost. That's the target every high-volume team should be aiming at.
The tension: OTel ingests everything by default, and that default causes both the pipe to the backend and the storage bill to be overwhelmed. Every database call, every health check ping, every routine API hit turns into a span. At real production request rates, that overwhelms the pipe to the backend and then overwhelms the storage bill right behind it.
Head-based sampling makes the keep-or-drop call at the start of a trace. Simple to configure, simple to reason about, and the right choice for low-complexity services where operational simplicity keeps the system easy to run even though it leaves some completeness on the table. Tail-based sampling waits until every span in the trace has arrived. It can then apply rules head-based sampling can't: keep every trace with an error span, keep every trace where total latency crosses two seconds. That kind of rule is impossible without seeing the whole trace first.
For high-traffic production services, a common pattern is low-percentage sampling for routine traffic using parent-based sampling, 100% for anything with an error, 100% for critical paths, and higher sampling rates for lower-traffic services where the extra coverage doesn't cost much.
Sampling rate isn't the only lever, either. Turn off noisy instrumentations, filesystem and DNS operations rarely tell you anything useful in an API stack. Filter out health check endpoints, which generate a lot of spans and zero diagnostic value. Set hard limits on attribute count and value length, since unbounded span size is a cost driver nobody notices until the bill arrives. Lean on tail-based sampling as the main mechanism for keeping errors. And keep that 1 to 10% baseline sampling running underneath it for the high-traffic services.
A sampler that drops error traces is worse than having no sampler at all, because the team loses exactly the data it needs mid-incident. That's the real argument for tail sampling, despite the extra infrastructure it requires. Research across 150 enterprise deployments found a 52% average drop in mean time to resolution for critical incidents, and that number only holds if the right trace is actually there when the incident fires. A sampled-away trace doesn't help anyone at 2am.
Context propagation across the service boundaries where API stacks break
Context propagation is the plumbing that carries a trace ID and span ID across HTTP headers, gRPC metadata, and message queue payloads, so every downstream service adds its spans to the same trace instead of starting a new one.
It breaks in predictable places. Third-party gateways and proxies strip custom headers all the time. The W3C Trace Context format, traceparent and tracestate, is the standard, but plenty of infrastructure out there just doesn't respect it. Async message queues are another weak point: producer and consumer run in different processes, often at different times entirely, so context has to live in the message attributes rather than an HTTP header that's long gone by the time the consumer picks it up.
Fan-out is its own problem. One request triggers several downstream calls at once, and parent-child span hierarchy, which models sequential calls fine, misrepresents what's actually parallel. Span links are the right tool here instead of forcing a false hierarchy onto parallel work. Batch jobs have the same shape: each item might generate its own trace, and span links tie those back to the originating job without pretending there's a strict parent-child chain.
When propagation actually works end to end, the payoff is straightforward: elevated latency in a metrics view connects directly to the specific trace causing it, which connects to the structured logs for that same trace ID. One navigation path, the whole stack, no guessing.
Semantic conventions round this out. Consistent attribute names, service.name, http.request.method, db.system.name, mean a dashboard built for one service works identically on the next one. Skip the conventions, and correlation queries break even when the trace IDs are propagating perfectly fine. The plumbing works, but nobody can read the pipes.
A realistic deployment sequence for teams starting from zero instrumentation
Sequence matters because OTel rewards patience and punishes big-bang rollouts. Teams that get this right treat it as a gradual build.
Start with auto-instrumentation on the highest-traffic services first, the ones where an outage actually costs money. Get traces and metrics flowing before touching anything else, logs included. Once that's stable, stand up the Collector with batching and the memory limiter configured early (not after the first traffic spike takes the Collector down). Add manual spans for business context on one service at a time, starting with whatever's hardest to debug today.
Sampling comes after there's real traffic data to look at, not before. Guessing at a sampling rate before seeing actual volume is how teams end up either drowning in spans or missing the one trace they needed. Tail sampling and its two-tier Collector setup are the last piece, once the basics are running and someone's actually looked at what the trace volume looks like in production.
None of this needs to happen in a week. It shouldn't need to happen in a week. The teams that stall out are the ones trying to instrument everything, sample perfectly, and propagate context flawlessly across every service on day one. The teams that succeed pick one pressure at a time, in order: get the spans flowing, get the Collector stable, then get the sampling rules right.